ONE-SAMPLE HYPOTHESIS TEST OF MEANS.
January 22, 2026
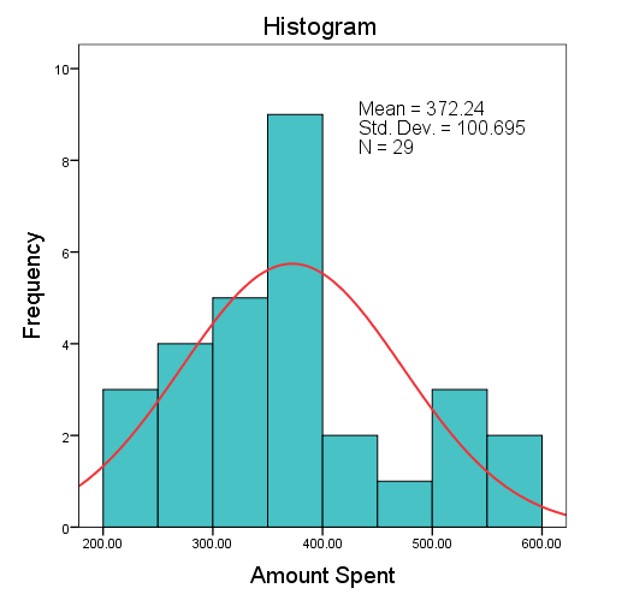
Depending on the p-value, we reject or fail to reject the null hypothesis (H0). If p-value < the significance level, we reject H0.
Hypothesis testing compares a sample mean to the population mean—a theoretical, an existing level, a rate, or a standard—to reject the null hypothesis.
In the following example, the company wants to find out the evidence to support the claim that the average consumer spending < $380 in a typical month.
A large retail company has a chain of stores. The chain store sales, given in the following table, represent a random sample of consumer spending in a typical month. Based on the hypothetical data given in the table, see if there is evidence that the average amount spent on groceries is less than $380. Use α= 0.05. Assume that the survey data collected by the store chain follow a normal distribution.
| Case | Store ID | Customer ID | Amount Spent ($) |
|---|---|---|---|
| 1 | 1 | 2 | 383 |
| 2 | 2 | 21 | 341 |
| 3 | 8 | 142 | 265 |
| 4 | 9 | 162 | 359 |
| 5 | 15 | 285 | 537 |
| 6 | 17 | 323 | 311 |
| 7 | 19 | 364 | 511 |
| 8 | 21 | 402 | 225 |
| 9 | 21 | 403 | 379 |
| 10 | 25 | 485 | 227 |
| 11 | 25 | 487 | 386 |
| 12 | 25 | 488 | 358 |
| 13 | 26 | 501 | 253 |
| 14 | 26 | 504 | 555 |
| 15 | 27 | 521 | 322 |
| 16 | 27 | 522 | 530 |
| 17 | 32 | 622 | 412 |
| 18 | 36 | 702 | 382 |
| 19 | 37 | 729 | 366 |
| 20 | 38 | 742 | 345 |
| 21 | 39 | 762 | 292 |
| 22 | 42 | 821 | 487 |
| 23 | 43 | 846 | 579 |
| 24 | 53 | 1044 | 403 |
| 25 | 54 | 1061 | 343 |
| 26 | 54 | 1062 | 289 |
| 27 | 54 | 1066 | 367 |
| 28 | 56 | 1106 | 202 |
| 29 | 59 | 1161 | 386 |
When we selected an α = 0.05 (or 95% confidence), we are accepting a 5% chance of being wrong (type I error).
Create the variables (StoreID, CustID, and Amount) directly in the variable view, and input the sample data into the data view.
| Name | Type | Values | Missing | Measure | |
|---|---|---|---|---|---|
| 1 | StoreID | Numeric | None | None | Nominal |
| 2 | CustID | Numeric | None | None | Nominal |
| 3 | Amount | Numeric | None | None | Scale |
- H0: The NULL hypothesis (States “No difference”)
- H1: The ALTERNATIVE (or research) hypothesis (States “There is a difference”)
TWO-TAILED TEST
- H0: µ = $380 Mean monthly grocery spending per consumer
- H1: µ ≠ $380 Mean monthly grocery spending per consumer
Run One-Sample T test…
Analyze → Compare Means → One-Sample T Test…
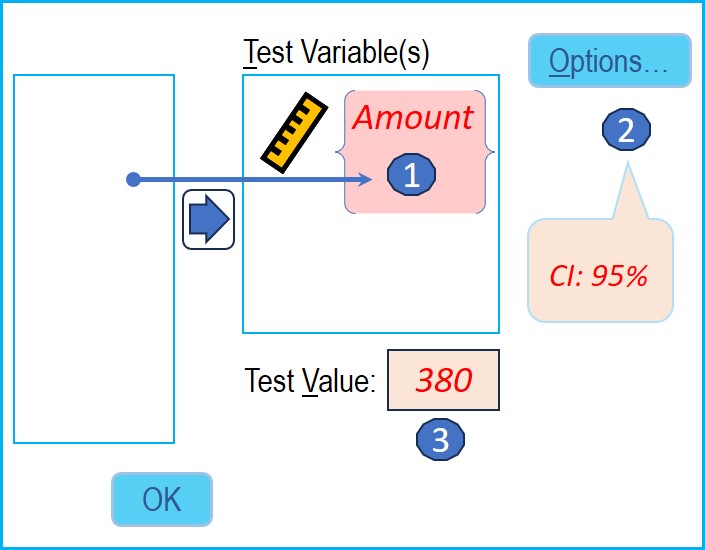
- Move the variable (Amount) into the “Test Variable(s)” box
- Options: Change Confidence Interval percentage (95%, 99% ..)—CI
- Input the value (380) into the “Test Value” box
- Run the test (OK)
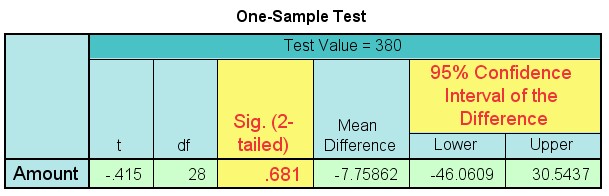
- Output: “Sig. (2-tailed)” is the P-value for two-sided test
The p value (0.681) is greater than 5% so we fail to reject the null hypothesis.
ONE-TAILED TEST
- H0: µ = $380 Mean monthly grocery spending per consumer
- H1: µ < $380 Mean monthly grocery spending per consumer
Run One-Sample T test…
Analyze → Compare Means → One-Sample T Test…
- Move the variable (Amount) into the “Test Variable(s)” box
- Options: Change Confidence Interval percentage (95%, 99% ..)—CI
- Input the value (380) into the “Test Value” box
- Run the test (OK)
- Output: “Sig. (2-tailed)” is the P-value for two-sided test.
The one-sided T Test, p-value should be (Sig. 2-tailed)/2. Therefore, one-sided T Test, p-value (0.3405) is greater than 5%. So, we also fail to reject the null hypothesis with one-sided T Test.

Home | Contact: info@gazersdigest.com
©2020-2026 Gazer’s Digest is an information-sharing platform using reliable sources to support the human-written articles. Gazer’s Digest includes topics, thought to be useful for the readers, and the contents may be related to investments. Gazer’s Digest is also a digital learning tool that helps you understand complex concepts, stay updated on trends, and sustainable solutions.